Edit chart
Loading graph
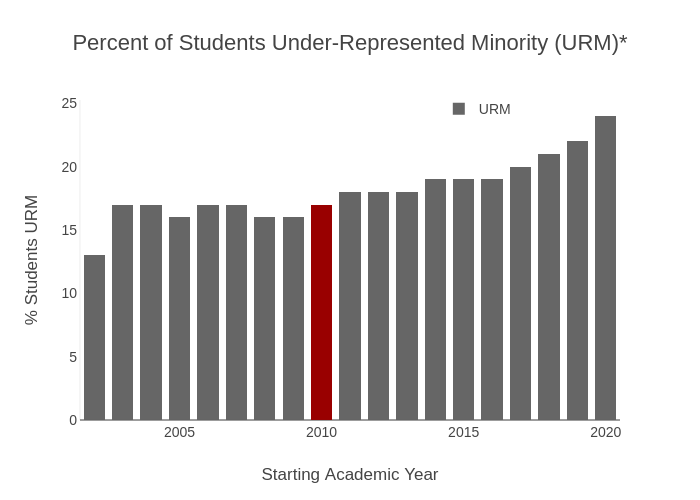
Provostncstate's interactive graph and data of "Percent of Students Under-Represented Minority (URM)*" is a stacked bar chart, showing URM vs Baseline URM; with Starting Academic Year in the x-axis and % Students URM in the y-axis.. The x-axis shows values from 2001.5 to 2020.5. The y-axis shows values from 0 to 25.263157894736842.